| Evoked potential |
| Intervention |
| MeSH D005071 |
The noninvasive objective direct quantitative method for vestibulo-cortical projection studies is method of Sensory evoked potentials or electrical potential (EP), in particular vestibular (VestEP), which reflects propagation of the excitation induced by specific stimulus, from peripheral receptor organs and peripheral nerves through brain stem to the cerebral cortex. Usually the term “evoked potential” is reserved for responses involving either recording from, or stimulation of, central nervous system structures.
Thus evoked compound motor action potentials (CMAP) or sensory nerve action potentials (SNAP) as used in nerve conduction studies (NCS) are generally not regarded as EP. Visual EP elicited by a flashing light or changing pattern on a monitor; Townsend GL, Cody DTR auditory EP by a click or tone stimulus presented through earphones or somatosensory (SSEP) elicited by tactile or electrical stimulation of a sensory or mixed nerve in the periphery have been widely used in clinical diagnostic medicine since the 1970s. On the contrary to the named EPs, VestEP does not belong to the classic recognized methods, widely used throughout the world. Starting from Götze and coll., 1964. There have been about 50 laboratories in the world, trying to launch the studies based at this method. Only few of them are now using it. The main reason is the ignoring of the basic physiological requirements for method development. To understand the typical mistakes, let us make a short overview of the results and the verification procedure necessary.
Contents
- 1. The vestibular analyzer
- 2. Verification of VestEP
- 2.1 Short latency VestEP (10 ms)
- 2.2 Middle latency VEMP (myogenic)
- 3. Parameters of VestEP
- 3.1 Static characteristics
- 3.2 Dynamic VestEP properties
- 3.3 Dynamic parameters of VestEP. Dependence on accelerations
- 3.4 VestEP changes in patients with established diagnoses
- 4. Dynamic properties of vestibular threshold at loading
- 4.1 Carioles forces
- 4.2 Information loading
- 4.3 Vibration loading
- 5. Application
- 6. Research and education
The vestibular analyzer
Concept of the vestibular analyzer means 6 sensors of vestibular periphery, space orientation sextad, 4 vestibular projections and 4 cortical vestibular areas.
Sensors of vestibular periphery are:
- Gravitation,
- Accelerations,
- Vibrations,
- Intensive sounds,
- Magnetic impulse,
- Metabolic,
- Space orientation sextad include: vestibular, visual, somatosensory, hearing, olfactory and magnetic sensory functions.
4 vestibular projections mean: vestibulo-cortical, vestibulo-motor, vestibulo-vegetative and vestibulo-limbic.
4 cortical vestibular projections mean vestibular representations in
- Vestibular,
- Somatosensory,
- Visual,
- Acoustic cortical areas.
Verification of the VestEP
Short latency VestEP (10 ms)
In the electrophysiological experiments it has been shown that the latent time between electric stimulation of the labyrinth and response of the vestibular nerve is about 0.9 ms. This is a little bit shorter, then the same for cochlear – 1.0-1.1 ms. So we might assume this value of about 1.0 ms to be the latency of the first peak of the short latency VestEP (angular VsEPA and linear VSEPL). It means that the stimulus duration has to be one order less, i.e., 0.1 ms.
Taking into consideration the inertial properties of the mechanical stimulator and the weight of the human of about 70 kg, it is extremely difficult problem to create such a stimulus. Additional subproblem in this condition is the low level acceleration fine control.
Second problem is the time constant of the mechanical components of otoliths and cupules, which is about 2-3 ms. This means that somehow it is necessary to overcome the innertiality of the otoliths and cupules itself to format a recording of the first peak of the short latency VsEPA and VSEPL.
Third major problem is the acoustic overlapping. 0.1 ms mechanical stimulus means 10 kHz, and is in the range of the acoustic stimulus. From this point of view the data presented seem to be not enough developed. The proof for this appears that the latency of the peak I is between 2 and 8 ms, it is variable, its clinical significance is doubtful and after the declaration about the successful development of the method – no results, no new inventions. We do not discuss the full scale verification procedure to be done thoroughly in this case.
In this situation magnetic EP, if it is really initiated in macula, appears to be more attractable, if the problem with macula time constant being overcome. But today this method is under development it needs serious verification procedure.
Middle latency VEMP (myogenic)
In this case the stimulus is intensive sound; recording electrodes are placed at the neck muscles. Method is characterizing the condition of the sacculo-muscular projections and is not corresponding the idea of evoked potential, which is to reflect the condition of the analyzer itself, i.e. vestibulo-cortical projection. It should be better called sacculo-muscular response, because identification “evoked potential” is mostly related to brain potentials. The problem is that it is necessary to apply the acoustic stimulus intensity of about 100 dBA, which is badly tolerated by the healthy persons and in the majority of the cases is intolerable for the patients. So, the clinical utilization of the method is seriously limited.
The other reports about the recordings with peak short latencies of 20-50 ms seem either to be inconsistent because of poor synchronization. In this case the peaks seem to be nicely recorded, but really they are of variable latency. The authors have to work out the stimulus profile to get stable response. Absolutely the same consideration might be applied to the reports of the recordings with peak latencies of the responses lying in the range of 200-500 ms. Poor synchronization results in the unrepeatable EP.
Among others the presentations of three groups appear to look attractable.
- I. The data being performed independently at different continents.
- II. They deal with long latency (LL) VestEP.
- III. The verification procedure is strictly elaborated.
- IV. The data coincides up to the standard deviations.
- V. There is a big bulk of clinical studies and inventions being made at the basis of this method use.
- VI. The method is spread with success to several other laboratories.
I. These data are worth more detailed analysis. The reports originate from teams of Dr. Trinus. (1983, Kyiv, Ukraine), Profs. Kast and Lankford. (1984, Chicago, USA) and Profs. Claussen and Schneider. (1990, Würzburg, Germany).
II. They deal with long latency (LL) VestEP
This is important, because the shortest peak latency is about 20 ms, that means the active phase of the acceleration is to be not more then 2 ms. As it has been reported the non-linear ascending part of the acceleration profile is about 1 ms duration, then the acceleration is almost linearly increases during 10 ms, in about 10 ms it inverses following almost parabolic function, and at last decreases to 0 in the next 10 ms. This acceleration profile provides very stable in shape response.
II. The verification procedure is strictly elaborated
It has been as following. For this purpose the group of 81 healthy volunteers is examined. Out of them 54 – being healthy, 27 – persons with different otological diseases, established in the otolarhyngological clinics of the city.
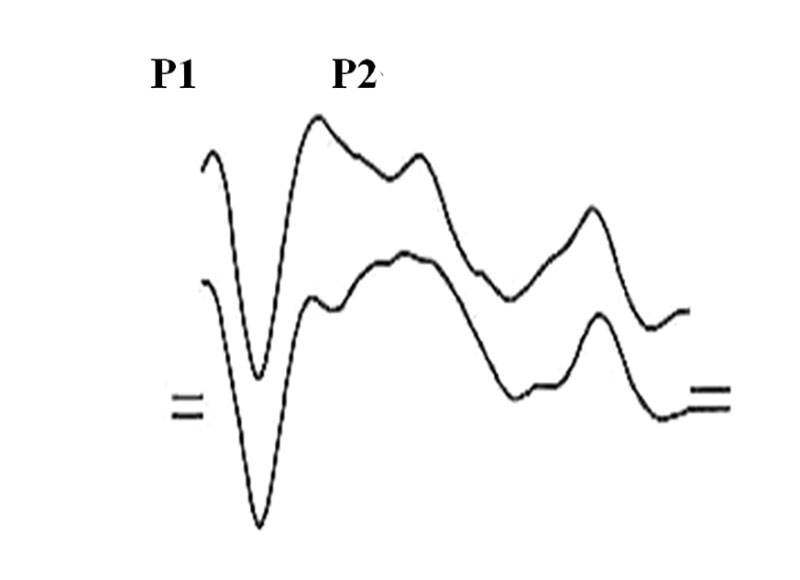
436 EP being recorded, out of them 52 – SEP, 19 – AEP, 63 – averaged spontaneous EEG activity, 306 – VestEP of healthy and ill persons. Realization time window being 256 ms with discretization rate of 1 ms. Averaged VestEP has appeared to be a response consisting of 3 principal peaks, 2 positive related to vertex and one – negative.
Latent periods (LP, latencies) being for Р1 – 20,1±14,0 ms (median ± standard deviation), N1 –59,5±21,3 and P2 – 147,0±27,0 ms.
Theoretical calculations have been made to rule out the spine to head mechanical stimulus transmission based at the properties of spinal cord. Similar calculations being done to eliminate the role of skin stimulation by the air while movement based at the data of skin sensitivity. It has been shown also that in the frame of the age form 15 to 55 the evoked potentials of the other modalities are rather stable.
At first 15 healthy volunteers being examined from the point of view of electric artifacts, myogenic and acoustic possible inputs in response to angular accelerations:
1. Artifacts from the devices elimination, being related to synchronization or synchronization impulse derivatives, has been performed both with the model of the person (equivalent resistors of 10 kOm each), and while recording the spontaneous EEG. With this purpose the mechanical drive has been disconnected from the rotating chair and ordinary recording have been made. The registration of the straight line is to be achieved.
2. For elimination of the e.m.f. (electromoving force) and its influence, which might be the result of movement of the wires between active and indifferent electrodes, the equivalent resistors of 10 kOm have been placed. The mechanical model of the person being placed in the chair. Total absence of any signals is to be achieved during recording and after averaging.
3. The elimination of the acoustic inputs has been the result of the next factors:
- а) all the mechanical components of the moving chairs are acting silently;
- b) recording of VestEP and AEP in the same persons has shown that the LP of the corresponding peaks of VestEP is 10-30 ms less then AEP;
- c) white noise is applied up to 100 dBA intensity into the earphones (the ear protectors are placed into the external acoustic meatus with the protecting capacity of about 40 dBA. In this case latencies of VestEP increase insignificant and AEP is abolished totally.
4. Evaluation of the input of the oculo-motor components is performed with the help of the oculograms, recorded either in the unique registrations or after the averaging. Oculo-motor potential is documented in many recordings even unique. It consists of negative rather sharp peak with the latency of 350-400 ms and positive peak, starting just after the first one, slowly grows to maximum in 1-1,5 s and has decreased to 0 in the next 2 s. Because this potential is out of the time range, where the VestEP is recorded its input into the VestEP components formation is assumed to be minimal.
5. The possibility of myogenic inputs has been studied in the next experimental series:
- а) Head and body of the person studied are fixed to the moving part of the chair. The response has the same shape as VestEP;
- b) Head being immobilized (being fixed to the headrest strictly fixed to the wall, the body of the person being moved – in the range of the threshold accelerations no EP is recorded. In our investigations we have never seen what is called cervical vertigo in condition described, if the head being enough strictly fixed. The increase of the acceleration up to 20°/s2 the SEP is possible to be recorded;
- c) SEP is recorded at the accelerations exceeding 20°/s2. During angular and linear movements the electrodes being placed at the neck muscles – the recordings averaged have revealed no EP.
6. Analysis of the spontaneous EEG have shown that in the α-rhythms presence it is possible to record some unstable configurations, which might change the shape of the EP recorded, that is why we escape patients examination in the period of high α-activity.
7. In two patients with established labyrinthine areflexia (result of surgical enucleation) VestEP are not recorded at the threshold levels. Acceleration increase gives the chance to record SEP, The patients inform about push and vibration sensations feeling being detected by muscles of the legs and back. These results have been later repeated and approved in Romodanov Institute of Neurosurgery (Kyiv, Ukraine) in the studies with dozens of patients, which survived statoacoustic nerve section because of acoustic neurinom.. Preliminary results in the studies with unilateral labyrinthine hyporeflexia have shown the increase of the peak latencies at the contralateral side. In the bilateral hyporeflexia the latencies increase is recorded at both sides.
8. The physical loadings (Carioles forces, galvanization, vibrations), which change the sensitivity of the analyzer, are changing correspondingly the latencies of VestEP.
9. VestEP is recorded only in the acceleration range, where the persons have reported the subjective movement sensations. In the other acceleration ranges they have failed to record VestEP.
10. In the patients with pharingitis and laryngitis the VestEP with typical for healthy parameters being recorded. This fact indicates no influence of unspecific factors and high specificity of VestEP.
All the studies performed give us the arguments to be sure that VestEP have vestibular origin, and the specific of the method is rather high exactly to the vestibular modality disorders, including functional ones of the different levels of analyzer.
Continuing the analysis of the three teams mentioned data we can follow the next points.
III. The data coincides up to the standard deviations
This is self understandable and does not need any commentaries.
IV. There is a big bulk of clinical studies and inventions being made at the basis of this method use
One of the first interesting facts being established by Claussen and Schneider is the brain cortex mapping and monitoring the procedure of the cortical processing of the EP generation both in healthy persons and patients. The movement sensation thresholds have been estimated with this method. The other data are discussed in the following review.
V. The method is spread with success to several other laboratories
As we have already mentioned the method is used now in Romodanov Neurosurgery Institute (Kyiv, Ukraine), where they have obtained big amount of data studying the patients with suspicion to acoustic neurinoma and patients with head trauma. In Donetsk (Ukraine) the team of Profs. Nikolenko and Lastkov have proved the vestibular lesions being the consequence of the professional hazard in miners, because of the general, local vibration and intoxications.
In Kyiv the joint Ukrainian-Polish team with participation of Profs. Kazmierczak and Mierzwinski have studied the interaction of different sensory inputs during caloric stimulation and vestibular habituation. The influence of chronic herpes on the vestibular function has been studied by Kaminskaya TA., et al.
According to evidence-based medicine (EBM) Oxford center recommends the definitions of the information reliability level identification:
- A. High reliability – information is based at the data of several independent clinical tests (CT) with coincidence of the data, summarized in the systematic reviews.
- B. Relative reliability – information is evidenced at the basis of at least several independent investigations, close to CT purposes.
- C. Limited reliability – information about one study results.
- D. The proofs are absent – idea is based at the expert’s opinion.
From this point of view it is worth of mentioning that the results mentioned have been cited by NASA experts (NASA Contractor Report 3922, №№ 13 & 23. USSR Space Life Sciences Digest, 1987 & 1988), which makes the information about VestEP method development to be highly reliable.
Sensitivity of the method has been estimated in comparison to the amount of the patients complaining of different types of dizziness (n=912 examinations, 672 patients) – 90.57%, specificity – 98.57%.
Parameters of VestEP
Static characteristics
Recordings are performed in the acceleration ranges of 0-40 cm/s2 0-20°/s2. In healthy persons at the level of threshold and threshold saturation acceleration level VestEP consists of 3 most stable extremes, 2 of which being positive to vertex, and 1 – negative (Fig. 1).
At the end of 70-th previous century the discussion about the diagnostic validity of the different EP parameters has taken place. This discussion has been closed by Prof. Rossi, when he has proved that most stable and diagnostically significant are temporary parameters of all the EP.
We have tried to study more wide range of characteristics. It appears that VestEP initiates after start of the movement with 6 ms time interval and is increasing with the angle of quasilinear part inclination (derived though cosines) of 48.4±14.8° and in 30.0± 8.5 ms Р1 reaches the amplitude of 1.2±0.7 µV.
Then, it decreases with the decline angle of quasilinear part of 70.9±9.3°, the zero line transition appears to happen with latency of 43.0±3.0 ms and proceeds with the same incline into N1, which reaches minimal amplitude of 2.6±1.1 µV, and in 70.3±12.5 ms has rather sharp peak and starts to grow with the approximation to quasilinearity of 72.6±8.0°, reaching zero line in 101.3±16.0 ms. Р2 grows with smaller angle 67,6±10,7° reaches the amplitude of 2.0±0.2 µV in 145.5±18.4 ms with decline angle 44.9±13.5°.
After reaching maximum Р2 there is no potential return to the zero line, but a series of unstable positive extremes, which because of their instability have no diagnostic value.
In the physiological and clinical studies the dynamic characteristic of EP are of basic importance, among them threshold stimulus levels at which the reaction is recorded and EP parameters from the stimulus level dependence. It is generally accepted to compare the EP threshold with the subjective sensations threshold.
For hearing function evaluation it is common to use tonal audiometry and objective audiometry the latter based at the AEP recording. That is why; the comparative analysis of the VestEP properties with the subjective sensations (behavioral threshold) being important.
Dynamic VestEP properties
At the threshold level three types of vestibular sensations have been found and as a result three threshold levels being identified: T1, T2 and T3:
- undiscriminated sensation threshold – 8.3±3.2 cm/s2;
- inverted sensation threshold – 12.2±2.2 cm/s2;
- discriminated sensation threshold– 17.7±2.5 cm/s2.
The minimal accelerations range, where the VestEP first appears coincides with the acceleration range for subjective sensations. It has appeared that VestEP is recorded at the acceleration levels lower, then the subjective sensations. The conventional threshold for VestEP TVestEP has been estimated the acceleration level of 5.7±1.8 cm/s2, at which the signal to noise ratio is not less, then 2:1.
Extremely important is that the latencies (LP) of different peaks decrease in non-parallel mode; this might be the key to understand the topics of VestEP peaks and corresponding sensations formation. At the transition from TVestEP to T1 the most crucial changes are recorded in the LP of Р2. As T1 characterizes the first subjective cognition of the motion, this indicates that Р2 is generated in the cortical zone of the analyzer.
Prominent decrease of LP of all peaks is seen at the T1 to T2 transition (acceleration – 5-10 cm/s2. From the diagnostical point of view the parallel latency increase of all the peaks might indicate the magistral pathway lesion, where the key role belongs to the rhomboid fosse nuclei neurons. It is especially important that both linear and angular accelerations causes the exact sensation of the direction and characteristic of movement.
The transition from T2 to T3 results in the most visible decrease of N1 peak LP. N1 is generated between the rhomboid fosse vestibular nuclei and cortical area of the analyzer. This might be one of the structures of medial longitudinal fasciculus, caudal caudatus nucleus, Deiters and Cajal nuclei, ventral posterior area (VPA) of thalamus, archicerebellar vestibular complex. In the case of VEP, AEP, and SEP it is accepted that the N1 peak is generated by the subcortical-to-cortical excitation transition. The total bulk of facts mentioned drive us to the understanding of the specific center of the formation of the space-and-movement estimation.
This center is localized in the subcortical area – because N1 peak is not of cortical or brainstem area. Taking into consideration the greatest convergence density of the sensory inputs at the level of medial longitudinal fasciculus (MLF) and importance of the thalamic VPA. One might consider these structures to be the most probable candidates for the N1 peak generation.
Synthetic analysis of the exact peaks LP in the ranges studied gives the chance to refine some peculiarities of the latency changes. Р1 LP is mostly changed (from 30.0±8.5 ms to 23.9±6.4 ms) in the range of T1 – T2 transition. As Р1 peak of all the modalities of EP is considered to be the filtered response of brain stem structures, it provides one more proof that the neurons of the vestibular rhomboid fosse nuclei are responsible for its initiation, this might be important for differential diagnostics of the pathology and individual selection of the therapeutical approaches.
As we have already noted LP of Р2 is mostly changed in the transition range of TVestEP to T1, and variability coefficient is increasing twice. Transition range of T1 to T2 being the range, where the latency of this peak continues to decrease, but in the T2 to T3 transition it is practically not changed.
So, in the formation of the VestEP Р2 peak the most important input is made by the mechanisms of undiscriminated detection of the movement. Movement direction discrimination starts from the subcortical level.
Analysis of variability coefficients of VestEP peak latencies has demonstrated that the most variable is Р1, and least is – N1. Interesting is that for Р1 it rests practically the same in all the acceleration ranges.
Variability of N1 negligibly increases at the transition from TVestEP to T1. And Р2 latency variability is progressively increased from TVestEP to T3, while statistically significant variability increase (from 6.67 to 12.56%) appears to be in the acceleration transition range of from TVestEP to T1.
Important parameter in electrophysiology is individualization (І) of the variability coefficients. This parameter is calculated as the ratio of interindividual to individual variability coefficients:
I = Iinter : Iintra,
where Iinter – is interindividual, interpersonal, variability, and Iintra – is intraindividual, intrapersonal variability. It shows how much do the data of different persons varies in between them. For subjective thresholds І appears to be: T1 – 1.5, T2 – 0.8 and for T3 – 1.9. The attention is attracted by the fact that least individual appeared to be the sensations of inverted direction threshold T2, and the greatest value has – T3. The biggest interindividual variability is characterized peak Р2. The individualization of the peaks appears to be different at the subjective sensations.
In the TVestEP range they are as following: ІР1 – 1.2, ІN1 – 0.8 and ІР2 – 1.0. In the range of T1: ІР1 – 1.3, ІN1 – 1.4 and ІР2 – 1.6. Let us pay attention that in this range the principal increase of ІN1 has occurred for 0.6 and ІР2 – also for 0.6. Individualization indicates less dependence of the reaction studied from the external stimulus. Thus, Р1, which is formed by mostly peripheral and brainstem structures, is more determined, then the reactions, generated by the subcortical and cortical structures. This indicates the minimum of endogenic components in the Р1 formation and their presence in the N1 and Р2.
In the T2 acceleration range I of VestEP peak latencies again is changed: ІР1 – 1.9, ІN1 – 1.2 and ІР2 – 1.2, and in the acceleration range corresponding to T3 it appears to: ІР1 – 0.7, ІN1 – 1.0 and ІР2 – 1.1. The great increase of individualization of Р1 peak is remarkable at the transition from T1 to T2. It indicates that in the inverted sensations acceleration range the Р1 peak formation is dependent not from external stimulus, but on the endogenic components and it reflects less the signal transmission at the brainstem, but mostly the excitation synchronization probably regulated with the help of the reticular formation nuclei in the brainstem.
This knowledge is principal from the point of view of the origin of the Р1 peak. It cannot any longer be regarded as a simply filtered brainstem response. Individualization of peaks N1 and Р2 in this area is non-significantly decreasing, indicating that the curve stimulus-response reaches saturation zone. Individualization of all the peaks statistically significantly decreases at T3, which indicates the considerable similarity of VestEP of all the persons studied in this acceleration area.
So, the most important conclusion being obtained out of variability individualization studies at the threshold acceleration level is the fact of the least variability and individualization of the VestEP peak latencies at the transition range of T2 and T3, which means about 12-18 cm/s2. It means that for clinical examinations, especially with time limited it is possible to recommend just the acceleration range of 15-18 cm/s2.
The results being presented are confirmed also with the phase-spectral characteristics studies of VestEP peaks. Preliminary studies of repeatability and mutual correlation of VestEP have shown the variability of principal peaks in the range of 0.6-0.9 (coefficient of correlation – inverted to coefficient of variability). Studies of power spectrum have allowed us to select the most important spectral components of 4 and 6 Hz.
For further analysis the CSM (Component Synchrony Measure) has been studied, which overcomes for 6 Hz component 70.0%, and for 4 Hz is just a little bit more, then the noise level. Preliminary analysis gives us the reason to assume that 4 Hz component might be the basis of Р2, and 6 Hz – N1. In this manner phase-spectral analysis provides us with one more argument to consider N1 as the most stable, and Р1 – as the most variable peak.
This is also supported in the studies of variability coefficients KP1 – 27.01%, KN1 – 13.69%, KP2 – 11.93%. Next, out of all the data the distribution of median mistake absolute meanings for the peaks of VestEP has been analyzed. Normal distribution of the median mistake modules is presented with typical bell-like curve, being described by Maxwell equation, with maximums mistakes in the ranges of Р1 – 7.0 ms, N1 – 7.5 and Р2 – 8.0 ms.
These meanings, together with LP median, standard deviations and variability coefficients, provide the basis for comparison of the healthy persons with any groups of patients or monitoring of any factors acting at the vestibular analyzer of healthy or sick persons.
That is why the important question being the shape of the VestEP in response to different stimuli: linear and angular. For this purpose in 19 healthy persons the VestEP have been studied in the response to angular accelerations in horizontal plane and linear acceleration upwards. In response to angular acceleration at the acceleration ranges of 5-20о/s2 the typical shape signal has been averaged, with typical peak composition, which has been visually identical to the response to linear acceleration, described earlier. Main static temporary parameters appeared to be the next. Latencies of the peaks: Р1 – 38.9±9.6, N1 – 81.7±13.4 and Р2 – 148.2±16.5 ms. Normal distributions of the median mistake modules have maximums in the ranges 8-9 ms. The symmetry of the normal peak distribution appeared to be: Р1 – 130.7, N1 – 453 and Р2 – 1456, indicating high level of the symmetry of Maxwell distribution.
The sharpness of the distribution also appeared to be rather high: Р1 – 21.0, N1 – 23.7 and Р2 – 7.5. Interindividual variety coefficients: Р1 – 21.1%, N1 – 12.7 and Р2 – 9.6%. Individual variety coefficients are smaller: Р1 – 4.1%, N1 – 4.8 and Р2 – 4.0%, providing thus individualization values of: Р1 – 5.1%, N1 – 2.6 and Р2 – 2.4%. It is worth of paying attention that only for Р1 individualization non-significantly overcomes 5.0% level, while for the other peaks they have been lower then this merge.
These data indicate the identity of the temporal parameters of VestEP peak latencies recorded in response to both linear and angular accelerations. The same idea is proved by using criteria of Fisher and Student the values of which are more then 0.3-0.5. Thus, nervous mechanisms of long latency VestEP in responses to linear and angular accelerations are identical, temporal characteristics are identical; it makes VestEP diagnostically valid for clinical practice.
Dynamic parameters of VestEP. Dependence on accelerations
So, the increase of acceleration causes the decrease of the latencies of VestEP peaks: for Р1 the decrease is 14.3 ms, LP of peak N1 – 17.6 and Р2 – 2.7 ms. This is understandable if one analyses the dependence coefficients:
Cd = Δ / LP,
where Cd – is dependence factor, coefficient, Δ – decrease of peak latency, LP – peak latency. The level of the dependence of the exact peak is individual and becomes less with the increase of the latency of the peak:
CdР1 = 42.19%;
CdN1 = 24.21%;
CdР2 = 1.84%.
The peak with the smallest LP – Р1 appears to be the most dependent from the stimulus, while Р2 is least dependable. Moreover, the dependence of LP on the acceleration is almost linear.
VestEP changes in patients with established diagnoses
In pathologic conditions vestibular dysfunctions are characterized with vertigo and dizziness complaints. Coordination disturbances are reaching middle level of expression. Two patients with bilateral labyrinthine areflexia have had neither subjective movement sensations nor VestEP recorded, at the accelerations of 25 cm/s2 they have noticed the vibrations and pushes with the muscles of the back surface of legs and back.
In patients with unilateral hyporeflexia the increase of LP latencies at the contralateral side are recorded. On the contrary to the loading tests the increase of the VestEP latencies in patients has been long lasting and stable. For more detailed studies group of patients with monogenic pathology has been selected. 39 patients with vibration disease being studied. In 27 of them at the level TVestEP – T1 VestEP is failed to be recorded. Only in 9 out of all the patients VestEP is recorded, in other 3 – the averaged EEG is found.
The average meanings of the latencies in the 9 mentioned patients: Р1 – 39.5±13.0 ms, N1 – 82.7±13.2 ms, and Р2 – 168.0±31.1 ms, which is statistically significant greater then for healthy persons.
Some interesting features have been found, while investigating the exact patient cases. For example, patient № 34 (diagnosis – vestibular dysfunction) has subjective thresholds at the levels of T1 – 10.0 cm/s2, T2 – 11.7 cm/s2, T3 – 38.6 cm/s2, one might visually note the principal increase of the T1 and T3 levels, with stable T2. Also important is decrease of the interval between T1 and T2 and significant increase of the interval between T2 and T3. This results in the accentuation of T2 and constant dizziness with light vertigo episodes in patient.
Another example, patient № 41 (diagnosis – vestibular dysfunction) has normal subjective threshold levels.
The VestEP structure looks like:
T1 P1 – 70 ms N1 – 110 ms P2 – 220 ms
T2 P1 – 40 ms N1 – 76 ms P2 – 130 ms
T3 P1 – 30 ms N1 –70 ms P2 – 136 ms
Similar data have been found in almost all the patients with vestibular dysfunction diagnosis; they might be summarized as following: the increase of T1 and T3, with stable T2 in the subjective threshold structure and increase of all the VestEP peak latencies.
Preliminary analysis of the types of changes of the stimulus-response curve has shown the possibility of three types of parameters changes:
- Right shear – means the decrease of receptor sensitivity.
- Decrease of the inclination angle of quasilinear part of the curve – change of the synchronization of the receptor activation.
- Saturation maximum decrease – decrease of the amount of receptors.
In the patients with established pathology usually all the three types of changes are manifested. The changes of the sigmoid curve in pathology also indicate the increase of the threshold in pathology, no matter which method of threshold estimation is used. As the threshold is shearing in parallel with VestEP latencies, the latter is also argumenting the possibility of unique EP recording for diagnostic purposes. The best acceleration range to be recorded is saturation phase or 15-20 cm/s2.
Taking into consideration that the latencies of the principal peaks are: Р1 – 30.0± 8.5 ms, N1 – 70.3±12.5 ms and Р2 – 145.5±18.4 ms, values of standard deviation and normal distribution of mistake modules in Maxwell distribution it is possible to derive the normative values for the peak latencies as follows:
Р1 – 20-40 ms,
N1 – 40-80 ms,
Р2 – 120-150 ms in the acceleration range 15-20 cm/s2.
So, this study has shown the possibility of documenting of vestibulo-cortical projection condition both with subjective and objective methods. This means that the projection is objective reality and vestibular cortical area also exists. The physiological parameters of vestibulo-cortical projection have been estimated for healthy persons both in relax and loading testing conditions. The preliminary studies have been shown that in the patients with estimated pathologies the parameters are changing.
And now it is time to use the approaches presented to the detailed studies of the pathology in vestibulo-cortical projection.
Dynamic properties of vestibular threshold at loading
Carioles forces
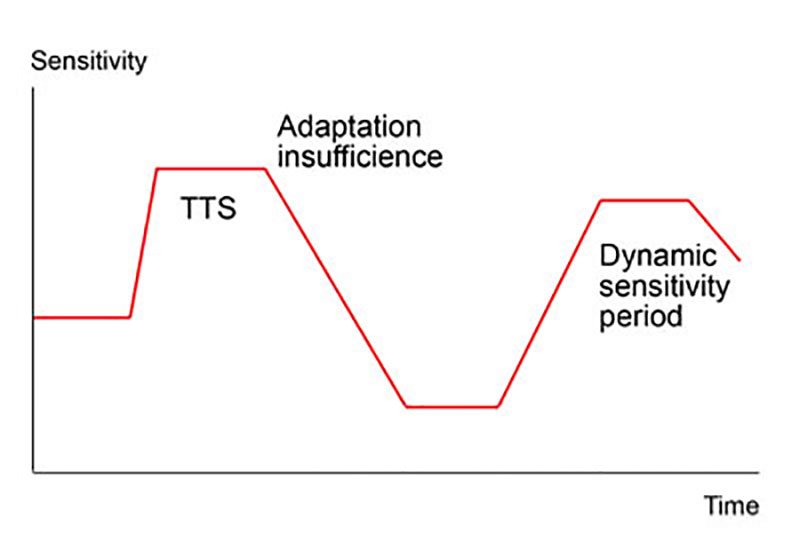
Carioles type of vestibular irritation is used for vestibular tolerance studies. There are many versions of these types of tests; the main idea is in the rotation of the head of the person studied in several angular planes. Usually, during Barany-like rotational chair revolutions the volunteer is proposed to bend or tilt his head in some specific for this or that test algorithm. Carioles acceleration initially causes the increase of peak latencies in all the persons (Fig. 2).
Detailed study of the VestEPs in the non-resistant persons (n=13) just after the vomiting episode, has shown that at the acceleration of 12 cm/s2 the latencies of peaks being decreased with coefficients of decrease: P1 – is 7.7%, N1 – 17.5% and P2 – 7.2%.
It is important to note the prominent decrease of N1, being known as the most stable one. The restoration of the sensitivity in all the volunteers has occurred through the phase of the increased latencies and increased thresholds with individual temporary dynamics (Fig. 2). The same data are revealed in the studies of subjective thresholds. In the persons tolerable to vestibular loadings the subjective thresholds appeared to increase correspondingly: ΔT1=0.4±0.2 cm/s2, ΔT2=0.4±0.8 cm/s2, and ΔT3=1.1±1.2 cm/s2.
These results indicate the unidirectional movement of threshold vector, determined by subjective and objective methods. The data presented looks very similar to the temporary threshold shift (TTS) of the acoustic threshold. The difference is that acoustic TTS has no threshold decrease phase (TDP). Studies of the visual threshold and pupillar reflex also have not revealed the threshold decrease. TDP seems to be important characteristic of the vestibular system. Its biological meaning and importance for the vestibular function is studied in the tests with informational (very mild) and vibration (intermediate) loading tests.
Information loading
Information loading chosen has been interactive car racing at the monitor screen. The peak latencies are increased in almost all the persons (n = 14).
The coefficient of increase is greatest for P1 – 27.7%, lowest – P2 – 9.6%. The greatest increase of the standard deviation is found for N1 – 74%, while for P1 and P2 they are 37 and 36% respectively. Surprisingly because in normal persons in relax conditions N1 peak has the smallest standard deviation. Statistical studies indicate that increase of standard deviation precedes the statistically significant changes of the parameter.
The greatest change of the standard deviation of the most stable peak indicate important change in future. The individual data analysis shown that in 75% persons an increase of all the peak latencies is noted; in 17% – a decrease of one peak latency, while the others being increased; in 8% – decrease of all the peak latencies. No one volunteer has vomiting or nausea episodes, though the ones with decreased peak latencies have complained of small discomfort. It is important to pay attention that visual loading has changed the condition of vestibular nuclei. The fact may have unique explanation – vestibular system performs important integrative role.
Vibration loading
Studies of this factor effect have been conducted in 1 and 2 hours sessions (n=29). In the course of 1-hour exposure the latencies increase for P1 from 23.2±3.0 to 45.6±14.9 ms, N1 from 68.0±22.2 to 104.0±23.5 ms, and P2 from 140.8±24.3 to 165.6±19.9 ms. The change for N1 is significant (p<0.05), for P2 reflects the tendency (0.050.1).
Analysis of the individual data shows that in all but one person the latencies have increased. In the last person being mentioned they have decreased moderately: P1 from 28 to 20 ms, N1 from 64 to 60, and P2 from 140 to 128 ms. Monitoring shown that return of the latencies to the initial level for N1 and P2 has passed through the increased latencies phase as compared with the initial figures: N1 – before loading 64 ms and after with a 15-minut interval – 60, 108, 68 ms; P2 – before 140 ms and after – 128, 180, 136, and 132 ms.
The return time to the initial level for all the parameters is in the range of 0.5-1.0 hour. The most exact return is noted for the N1 peak and the least for P1 (α coefficients of the two-tailed t test control versus the last values). After 2 h of vibration exposure the increase of the absolute values of the latencies is also noted. They are for P1 from 28.0±16.2 to 34.4±21.7 ms, N1 from 74.4±28.7 to 91.2±34.1 ms, and P2 from 126.4±14.9 to 149.6±45.0 ms.
But these increase is not significant. Individual data analysis shows that out of 5 persons examined, peak latencies have increased in 2 persons and in 2 other persons – decreased. In one person the latencies of P1 and N1 does not change, and P2 – decreased. The latencies in this person have decreased 0.5 h after the loading cessation and remains decreased over the next 1 h.
For example: N1 – before loading being 128 ms and after loading with 15-minut interval: 128, 72, 68 and 60 ms.
Analysis of the peak latencies dynamics after loading in the 2 persons whose peak latencies have decreased shows that for the 1 h range the data for P1 and N1 appear to preserve the decreased values, while for P2 they are moving to the initial level through the increased latency phase. It is important to note the mild discomfort with some dizziness and nausea in the patients with decreased latencies, which neither is nor accompanied any vegetative manifestations. This is important in the comparison with the other loading tests.
In pathology the relativistic approach has shown at least three possibilities (Fig. 3):
- the decrease of saturation;
- the decrease of the inclination angle;
- right shift.
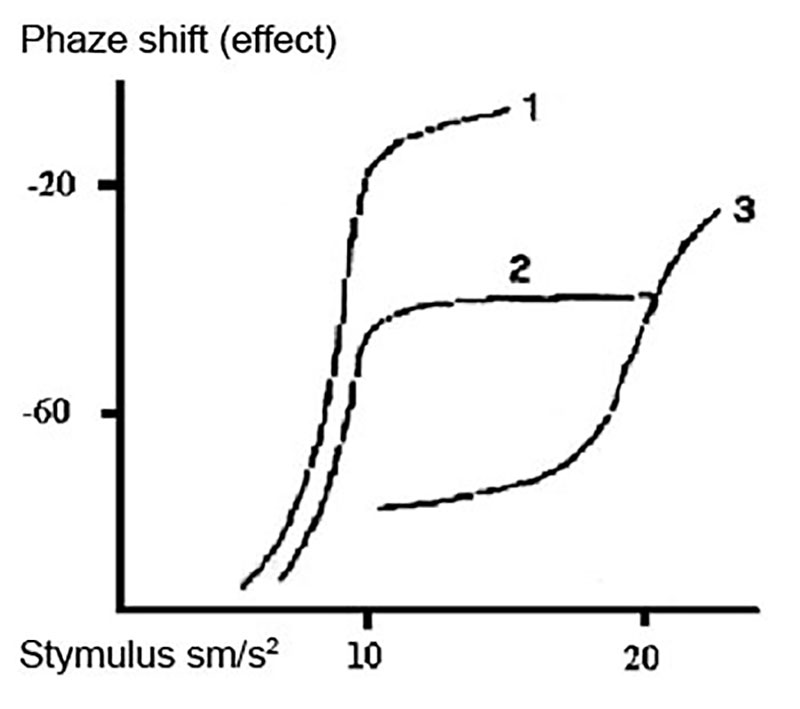
The combination of all is also possible. The first situation means the decrease of the amount of the receptors activating. It might happen in the situations when the receptors are blocked, for example, because of the appearance of blocking agents or toxins. The decrease of the receptor amount might be the result of their degeneration, increased resorption or decreased synthesis.
Many mechanisms might be at the basis of each of the events mentioned. The inclination angle decrease means the synchronization problems. It might happen because of change of electrolyte balance or receptor reaction time, conformational changes in the receptor, etc. Right shift indicates the change of the receptor properties and its sensitivity.
Threshold is one of the most important characteristics of all the sensory systems. Traditionally, the subjective conventional threshold studies have been used, but the future belongs to the objective relativistic threshold estimation procedures. System sensitivity, being measured through threshold, is a dynamic parameter, depending on many environmental influences. Usually, the loading increases the threshold, decreasing the sensitivity, thus protecting CNS from information overloading.
Vestibular analyzer is unique in the threshold decompensation phenomenon. Long-lasting intensive irritation causes threshold decrease, which results in the kinetosis symptom complex. This reaction becomes understandable, regarding it from the point of view of metabolic sensor and toxins elimination from the organism. Individual threshold dynamic is an important feature of the brain education capacity and might be useful for special contingents professional selection and monitoring. In pathology relativistic approach to the threshold estimation might disclose the character of the pathological process developing in the organism.
Application
Anatomic and physiologic basis for differentiating of vertigo, dizziness and space orientation disorders is elaborated with complex of vestibular tests, including VestEP.
Light head trauma starts as a vestibular dysfunction.
The positive influence of betahistine on the patients with peripheral vestibular disorders being monitored with the help of vestibular evoked potentials.
Long-lasting consequences of vestibular damage, monitoring of patients, including medication studies.
Tinnitus is related to vestibular disturbances.
Low-frequency whole-body vibration cause vestibular damage.
In the patients with diabetes polimodal EP reveal peripheral nerves dysfunction, especially pronounced in visual and vestibular peripheral organs.
Among arrhythmic patients 15-30% appeared to be vestibular-dependent.
Herpes virus infection in military stuff and their family members cause early vestibular damage.
Low doses of radiation cause primary vestibular damage, which need vestibular function correction. The latter crucially improves the patient condition.
Early vestibular damage in Chornobyl clean-uppers (miners exposed also to vibrations) lead later to immune deficiency.
Evoked potentials (including vestibular) are used for differentiation of neurosis, encephalitis and epilepsy.
Research and education
Scientists at the International Project «Happy Vertigo» are working to understand the various space orientation disorders and the complex interactions between the sensing organs and the brain. International Project «Happy Vertigo» scientists are studying brain electric signal propagation, movements of the body parts and eyes, vegetative and emotional reactions to understand the changes that occur in health and disease conditions, aging and injury, as well as collecting data about effective treatment protocols for space orientation disorders.
The International Project «Happy Vertigo» is conducting research to develop new tests, devices and refine current tests of sensory functions, balance, vegetative reactions and emotions.
For example, International Project «Happy Vertigo» scientists have developed computer-controlled systems to monitor functional condition of sensory systems, forming sextad, eye and body position and movement while stimulating specific parts of the nervous systems. Other tests to determine disability and improvement caused by the factors of progress, as well as new prophylactic and rehabilitation strategies, are under investigation in clinical settings.
The International Project «Happy Vertigo» specialists are creating education courses for training and postgraduate education of healthcare stuff.
Scientists at the International Project «Happy Vertigo» hope that new data will help human beings to develop strategies to use progress for profit, health and pleasure and to prevent the hazards in the extreme temp of progress propagation.